2. Methods
MSD’s electrochemiluminescence detection technology uses SULFO-TAG™ labels that emit light upon electrochemical stimulation initiated at the electrode surfaces of MULTI-ARRAY® and MULTI-SPOT® microplates. are excited, enabling non-washed assays.The MSD® S-PLEX Neurology Panel 1 is a three analyte ultrasensitive panel. The S-PLEX® platform uses ECL technology, retaining its well-known advantages and superior analytical performance. The improved sensitivity of S-PLEX assays is due to the new TURBO-TAG® and TURBO-BOOST® reagents. This assay was validated using a custom protocol designed to reduce time to results. Incubation times are reduced by 30% compared to the commercial kit protocol and are performed at +27°C.
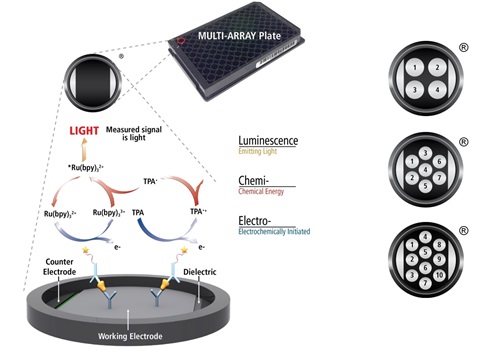
Electrochemiluminescence Technology
- Minimal non-specific background and strong responses to analyte yield high signal-to-background ratios.
- The stimulation mechanism (electricity) is decoupled from the response (light signal), minimizing matrix interference.
- Only labels bound near the electrode surface are excited, enabling non-washed assays.
- Labels are stable, non-radioactive, and directly conjugated to biological molecules
- Emission at ~620 nm eliminates problems with color quenching.
- Multiple rounds of label excitation and emission enhance light levels and improve sensitivity.
- Carbon electrode surface has 10X greater binding capacity than polystyrene wells.
- Surface coatings can be customized
3. Results
A. Detection Capability
Table 1 – Limits of detection and quantification for the S-PLEX Neurology Panel 1 assay using the modified shortened protocol.
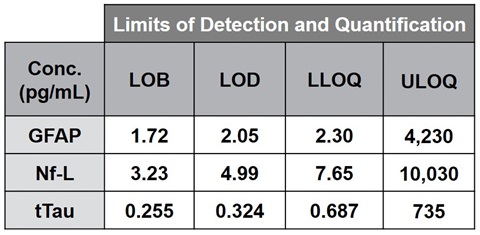

Figure 1 – Representative calibration curves for each analyte in the MSD S-PLEX Neurology Panel 1 using the modified shortened protocol.
Quantification of the analytes was determined by reference to an eight point calibration curve (Figure 1) run on each plate and fit to a four parameter logistic (4PL) model. The limits of quantification were determined according to CLSI guidelines EP17-A2 by measuring four high level, eight low level, and four blank samples in quintuplicate on three plates each for two reagent lots. The total error (TE) was calculated via the root mean squared model for each sample on each reagent lot and the TE cutoff value was ≤ 25%.
• Lower limit of quantification (LLOQ) was determined as the lowest concentration sample where the TE ≤ 25%, and the higher value between the two reagent lots.
• Upper limit of quantification (ULOQ) was determined similarly as the highest concentration with TE ≤ 25%, and the lower value between the reagent lots.
• The limit of blank (LOB) was determined by the measurement of four different blank samples on two reagent lots. The measurements of the blank samples were rank-ordered and LOB was determined as the 95th percentile of the calculated concentrations.
• The limit of detection (LOD) was determined by the measurement of four different blank samples and four different low level samples on two reagent lots. LOD is the minimum concentration such that 95% of measurements of a sample with concentration equal to LOD will exceed the LOB.
B. Clinical Range – Alzheimer’s Diseased Samples
• To demonstrate the ability of the assays to measure the relevant concentration ranges of the target analytes in plasma and CSF, healthy and diseased matched plasma and CSF samples were tested on the MSD S-PLEX Neurology Panel 1.
• All samples were within the limits of quantification. Data are shown in Figure 2.
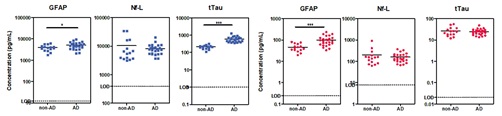
Figure 2 – Sample concentrations of AD (n=25) vs non-AD (n=15) CSF (left, blue) and EDTA plasma (right, red). Samples were tested blinded and in duplicate. Mean intra-plate CV was <5% for all analytes. Dashed lines indicate dilution-adjusted LOD (100-fold for CSF and 2-fold for EDTA Plasma). Differences of means were calculated by student’s t-test. * = p-value ≤ 0.05, *** = p-value ≤ 0.0001
C. Dilution Linearity
Dilution linearity of the MSD S-PLEX Neurology Panel 1 was determined in three stages adapted from the CLSI guidelines within EP06-A2.
• Linearity was shown to be within 80-120% over a 256-fold dilution range by testing serially diluted pooled adult human serum and plasma that had been spiked with calibrator at the upper end of the quantitative range. Representative data are shown in Figure 3.
• Dilution linearity was verified using 64 individual neonatal samples diluted 5-(recommended dilution), 10- and 20-fold. Further dilutions were not tested due to the low sample volume available. Summary Nf-L results for all donors are shown in Figure 4. GFAP, Nf-L, and tTau are all observed to dilute linearly within 20%.
• Dilution linearity of neonatal serum samples was tested by preparing “high” and “low” pools of HIE samples into a 5-sample panel using equal-volume mixing. All analytes showed linearity within 20%. Representative data are shown in Figure 5.
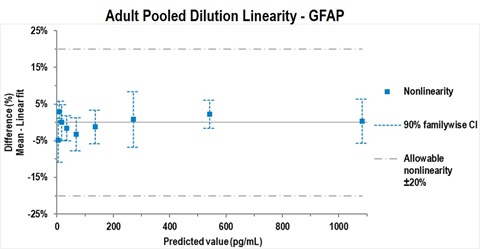
Figure 3 – Representative example of testing according to CLSI EP06-A study design A1. GFAP was spiked into pooled adult serum and serially diluted in assay diluent. All values for GFAP, Nf-L and tTau fell within 20% deviation from linearity (dashed line). Data were analyzed using Analyse-it software.
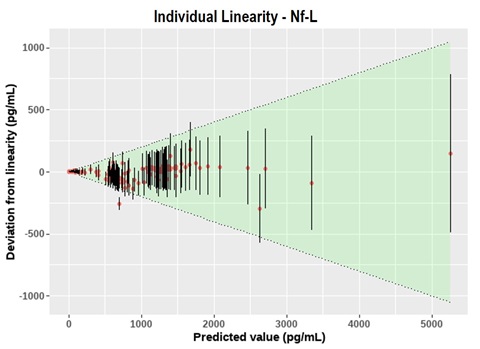
Figure 4 – Summary of dilution linearity testing on 64 individual neonatal HIE samples for Nf-L. The shaded green area indicates the allowed limits of deviation (±20% from linear). Error bars indicate the 95% CI based on a typical intra-plate CV of 6%. All assays were observed to dilute linearly within 20%.
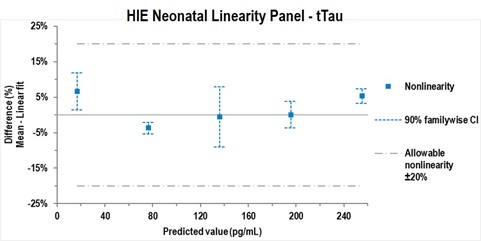
Figure 5 – Representative example of CLSI EP06-A study design B, which used a linearity panel produced by pooling HIE samples with high and low levels of a biomarker using equal-volume mixing. Representative data are shown for tTau. All values for GFAP, Nf-L and tTau fell within a 20% allowable deviation from linearity. Data were analyzed using Analyse-it software.
D. Precision
A precision study was designed based on CLSI Guideline EP05-A3 and modified to assess precision within laboratory (total) and between operator, day, run, and replicate (repeatability). Briefly, 10 samples (five EDTA plasma, five serum) were spiked with a blended calibrator preparation at five levels spanning the expected range and vialed in single-use frozen aliquots. Five analytical controls spanning the expected range were lyophilized in single-use vials. Five operators each performed four days of testing with two simultaneous, vial-independent runs per operator per day, spanning a total of 20 calendar days, resulting in 80 measurements per sample overall.
For all samples within the limits of quantification, all assays achieved a total %CV ≤ 20%. Detailed results for a representative sample are shown in Figure 6, and precision estimates for the entire quantitative range are listed in Table 2. The residual error (error between replicates) is <6% CV for all analytes, and the total within-laboratory precision was 11% for GFAP, 10% for Nf-L, and 19% for tTau.
Table 2 – Precision estimates for components of potential variability.
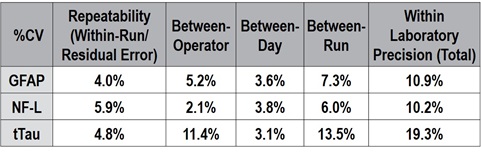
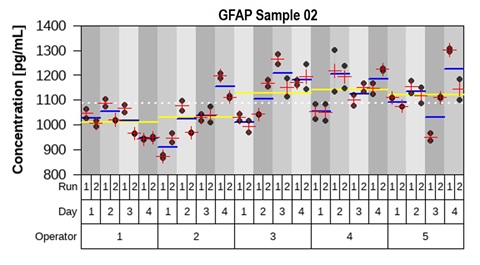
Figure 6 – Representative measurements of one sample from the precision study. The mean concentration between replicates (red cross), between runs per day (blue line) and between operators (yellow line) are plotted against individual measurements. Variance component analysis was completed with R using the package “VCA.”
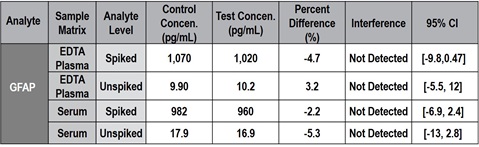
E. Interference Screening
Fifteen common laboratory and medical substances listed below were screened for interference with the MSD S-PLEX Neurology Panel 1. Samples spiked with the maximum clinically relevant concentration or a mock spike were compared, and none showed interference exceeding 18% in paired-difference testing. An example summary of interferent screening for the ampicillin effect on GFAP is shown in Table 3.
- Ampicillin
- Morphine
- Benzodiazapine
- Phenobarbital
- Morphine
- Erythropoietin
- Phenytoin
- Piperacillin
- Bilirubin (unconjugated)
- Tazobactam
- Gentamicin
- Topiramate
- Levetiracetam
- Vancomycin
- Melatonin
- Bilirubin
- (conjugated)
Table 3 – Summary of interferent screening for ampicillin on GFAP. In all cases, the point estimate for the percent difference was below 18%, which led us to conclude that ampicillin is not a significant cause of interference for GFAP at high or low concentrations. In most cases, the 95% confidence interval crossed 0, which indicates that the null hypothesis (i.e., ampicillin does not alter analyte measurements) could not be rejected.
F. Spike Recovery
Spike recovery was determined first by spiking individual adult serum and plasma samples with three levels of calibrator, then diluting 2-fold (recommended dilution for adult samples). These GFAP, Nf-L, and tTau assays are shown to recover the spiked calibrator within 80%-120% at 2x dilution in serum and EDTA plasma, as shown in Table 4. Next, individual neonatal HIE samples (n=64) were used to verify spike recovery. Samples were spiked with <5% overall volume of calibrator and diluted 5- (recommended dilution for neonatal samples), 10- and 20-fold, as shown in Figure 7.
Table 4 – Spike recovery range of each analyte in 2-fold diluted serum and EDTA plasma.
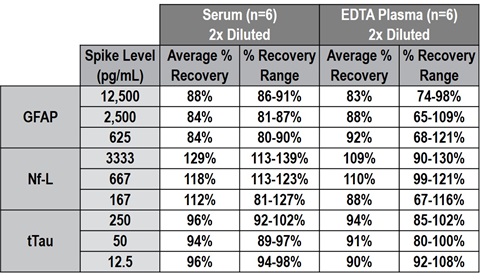
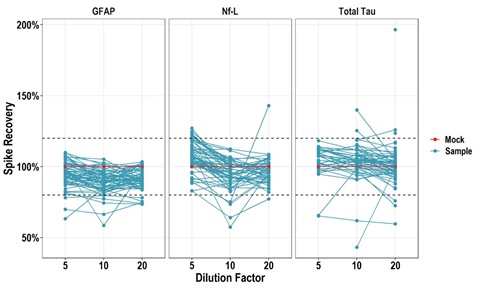
Figure 7 – Spike recovery testing of 64 individual neonatal HIE samples (cord blood) showing recovery of GFAP, Nf-L, and tTau in most samples remains within ±20%
(dashed lines) at 5-, 10-, and 20-fold dilution.
G. Cross-Reactivity
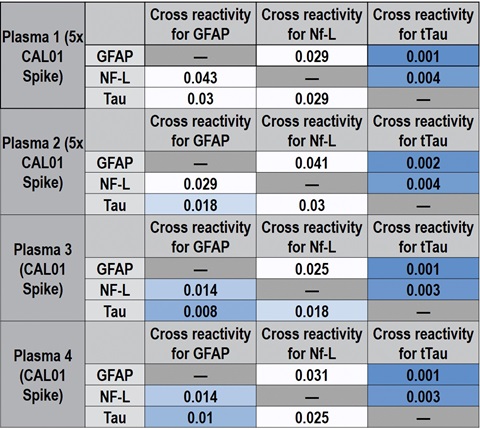
Cross-reactivity between GFAP, Nf-L, and tTau was calculated for both calibrator and native samples by using individual calibrators and individual detection antibodies. Some cross-reactivity of the GFAP calibrator with the Nf-L (3.5%) and tTau (2.7%) assays was observed, presumably due to non-specific binding of the recombinant GFAP calibrator, shown in Table 5. This cross-reactivity was not observed for native samples spiked at the CAL 01 level or at 5-times the CAL 01 level. For all target and assay combinations, cross-reactivity was <0.1% in native matrices and should not affect sample quantitation, as shown in the representative data in Table 6.
Table 5 – Summary cross-reactivity data for individual calibrators and detection antibodies.
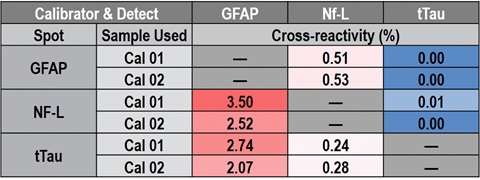
Table 6 – Representative cross-reactivity data in native samples.
4. Conclusion
MSD has developed and analytically validated a highly sensitive, multiplexed immunoassay for quantifying GFAP, Nf-L, and tTau in plasma and serum. This assay is sufficiently sensitive to detect these analytes in normal serum and plasma and has a large dynamic range to accommodate elevated levels found in some neurological disorders, making it suitable for associated research.
5. Funding
Research reported in this publication was supported by the National Institute Of Neurological Disorders And Stroke of the National Institutes of Health under Award Number U01NS114144. The content is solely the responsibility of the authors and does not necessarily represent the official views of the National Institutes of Health.